iStrategy announces HigherEd Analyzer (TM) data warehouse and analytical portal solution for colleges and universities
|
Owings Mills, MD, Feb. 28, 2003 -- HigherEd Analyzer (TM) is a packaged data warehouse and analytical reporting application for colleges and universities from iStrategy. HigherEd Analyzer provides secure self-service reporting and analysis capabilities to a broad spectrum of information users spanning institutional research, management reporting, external reporting and analytical information needs across the institution. We have incorporated many of the metrics and descriptive attributes recommended by the National Center for Higher Education Management Systems (NCHEMS) and other experts in higher education management. Look for the iStrategy booth at NERCOMP in Worcester, MA March 17-18 and at AACRAO in DC April 7-8. Shift Toward Information-based Management Over the past few years there has been a rapid shift in higher education towards more formalized information based planning, management and measurement methodologies. Some of the high visibility focus areas that center on information include: |
|
|
|
Common Reporting Challenges Many institutions are challenged by the lack of information and the inability to get information out of their legacy or ERP systems. Most student administration systems provide basic transaction reporting capabilities, but they fall short when it comes to historical reporting, management information and analysis. These complex databases are structured for transaction processing, audit trail and controls, not ease of reporting. The impact is significant:
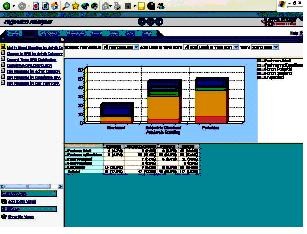
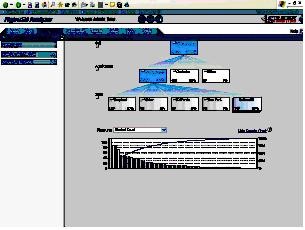
Our Vision .....To enable self-service reporting and analysis of institutional information, for both casual and power users, through an intuitive, secure and robust application. HigherEd Analyzer's application framework goes beyond basic reporting. Using widely adopted higher education metrics and best practices for analytics, we enable guided analysis through key performance indicators, visualization components and interactive reports. There is a rapidly growing trend toward analytical applications for business intelligence. With the right technology, the insights to see what is happening and understand why can be a reality. We also see an opportunity to improve the education process by using advanced analytics to provide early warning detection of students with academic problems, student benchmarking capability, retention analysis, course planning and other analytical capabilities aimed at directly helping students. Value Proposition When it comes to analytical reporting capabilities, there are not many options. The higher education ERP vendors do not offer a viable solution, and building it from scratch is a very time consuming, expensive and risky proposition. Data warehousing initiatives at most colleges and universities can easily take one or two years and quickly exceed $1 million. Independent research data has shown that quite often these DW initiatives fail to deliver on the initial promise and fall well short of expectations. With our out-of-the-box solution template, we can quickly deliver a robust capability that cuts deployment time to as little as 4 to 6 weeks, and the cost to implement is a fraction of the cost to build a data warehouse and reporting application from scratch. We also recognize that each institution is unique and provide a framework to efficiently extend the data model to support additional information needs and metrics. HigherEd Analyzer can also integrate with an existing data warehouse to leverage your investment. The HigherEd Analyzer database essentially acts as a data mart providing the benefits of a pre-built analytical application. Information Scope The information content spans the entire student information lifecycle from recruiting through graduation. The focus is on providing key measures segmented by the key dimensional attributes that apply to each category of information. Below are some of the information categories we provide: |
|
|
|
By combining the entire student information library into a single integrated dimensional database, HigherEd Analyzer (TM) delivers analytical content that provides insights that are otherwise difficult to uncover.
Student ERP Vendor Integration Our current target partners include PeopleSoft, Datatel and SCT. We plan to expand our ETL integration for additional vendors based on market demand. |
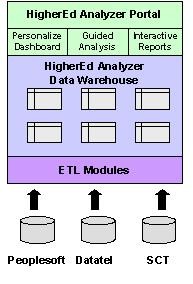 iStrategy's HigherEd Analyzer (TM) removes the complexity from the process by providing all of the components necessary to deliver self service analytical reporting.
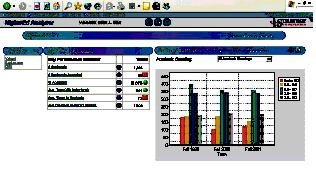
|
The Analytical Portal provides a simple yet secure browser based interface for analytical reporting. HigherEd Analyzer (TM) utilizes the ProClarity Analytical Server (PAS) from ProClarity Corporation to provide a powerful analytical capability using a true thin client interface. ProClarity Corporation won the DM Review 2002 World Class Solution Award in the Business Intelligence category for the second year in a row and Microsoft's Industry Solution Award for the "Best Business Intelligence and Data Warehousing Solution". In additional to the Analytical Portal, other third party reporting and analysis tools may also be used to access the HigherEd Analyzer data warehouse. As such, you can leverage any investments in tools such as Crystal Reports. In short, HigherEd Analyzer utilizes best in class open technology and is based on a proven data model that follows best practices prescribed by leading authorities such as The Data Warehousing Institute and Ralph Kimball.
|
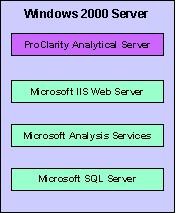 The Data Warehouse provides a data model designed for ease of access and high performance reporting. Additionally, reporting and analysis is very fast with the pre-aggregated OLAP tier. Almost all of the reports run in one to three seconds. The data warehouse is developed using Microsoft SQL Server 2000 and Microsoft Analysis Services, which provides both the relational and OLAP engine through the same database license. The ETL component is develop using Microsoft's Data Transformation Services (DTS) which is included with SQL Server.
 For more information, contact: Mark J. Max Managing Partner iStrategy Consulting 10715 Red Run Blvd., Suite 107 Owings Mills, MD 21117 (410) 581-0180 mmax@istrategyconsulting.com www.istrategyconsulting.com